Ever wondered why a particular video gained all the attention overnight? What makes a video viral on YouTube? Why your competitor is able to get maximum views on videos? How does the audience consume video content on YouTube? The answer to these questions is YouTube analytics.
YouTube analytics is a simple process that tells you all about your video performance on YouTube. The process is used by most marketers that use YouTube as a platform to promote and market their brands. YouTube is great, but also weird. It can be extremely useful or completely pointless. The type of content on YouTube ranges from life hacks and tutorials that teach you how to boil water!
The point we are trying to make here is that YouTube is a goldmine for audience reach. The platform is used by diverse audiences from every part of the world which makes it extremely significant for marketing.
To give you a deeper understanding of how wide the audience base is, on YouTube, take a look at these listed stats!
- YouTube is the second largest search engine after Google
- The majority of YouTube users fall under the age group of 15-35
- Around 25% of worldwide mobile traffic comes from YouTube accounts
- The largest countries that account for the most of YouTube traffic are- 16.4% from the US, 9.2% from India, and 4.8% from Japan
- YouTube ranks second as the most popular platform for influencer marketing
Well, these YouTube statistics clearly show that marketers can achieve a lot if they use this platform right.
Reach is important for any marketing strategy, but a platform as big as YouTube also presents huge competition. This is why understanding how YouTube analytics works is very important.
Table of Contents
- What is YouTube Analytics?
- Benefits of YouTube Analytics
- How to Set Up a Brand Account on YouTube?
- Crucial YouTube Metrics to Analyze
- How To Conduct YouTube Analytics
- Tips to Improve YouTube Strategy
- Key Takeaways
Let’s begin!
What is YouTube Analytics?
YouTube analytics is a process wherein you can assess the performance of your video content on the platform. The analytics is carried out with the help of YouTube metrics that help you get in-depth channel insights. Initially, YouTube analytics was a tool launched by YouTube itself wherein creators could check their content performance and audience base. But now, this analysis can be done with the help of YouTube analytics tools too.
With the help of YouTube analytics, creators and marketers can get an understanding of the effectiveness of their content and marketing strategies on the platform.
Right from gathering YouTube channel metrics, studying Youtube subscribers to coming up with YouTube performance reports, everything forms a part of YouTube analytics.
Benefits of YouTube Analytics
Here is why YouTube analytics is a crucial part to help you get the most out of the platform and your strategies.
-
Insight into how your content is being consumed
When you conduct YouTube channel analytics you will get data that helps you detect the pattern of how your content is being consumed by the audience. This can tell you a lot about audience behaviour and will help alter your content strategies.
-
Helps detect what content is helping you grow
Tracking YouTube channel stats will give you an idea of how your content is impacting your subscriber count. Analyze closely to know what kind of videos are helping you gain more subscribers and what is making them click the unsubscribe button!
-
Get YouTube channel demographics
The YouTube channel demographics will give you an account of what your subscriber base consists of. Right from the age, gender to location, the demographics report will help you know your audience base better. Additionally, it will help you figure out whether you are targeting the right audience for your brand goals and objectives.
-
Helps you monitor progress
Simply keeping a track of your subscriber count is not enough to evaluate your strategy on YouTube. It is necessary to monitor other YouTube metrics too like retention rate, views, total dislikes, and so on. Tracking this data will give you an insight into the overall performance of your channel. Moreover, the data also shows where your strategy is failing.
-
Get an understanding of what your YouTube competitors are doing
YouTube analytics for other channels can be termed ‘Competition Tracking’. There are YouTube analytics tools designed to help you analyze your YouTube competitors. Know what is working for them and what is fetching them engagement and subscribers on the platform.
While these are some basic benefits of conducting YouTube analytics for your channel, the question is how to go about this process and what to measure. But before that, let’s look at the steps to create a brand account on the platform! (Feel free to skip to the next section if you are already a PRO! )
How to Set Up a Brand Account?
It is advisable to have a brand account if you want to create a channel for your business.
Why? Because a brand account allows you to assign multiple managers and owners to the channel. This makes the handling of a business account very easy.
Here are the steps you need to follow to create a brand account:
- Log in to YouTube from the account you want to use to manage your brand account.
- Check the menu on the top right corner of the window. You will find a Settings option.
- Clicking on the settings option will direct you to a new window. Then click on Accounts if it isn’t selected by default. Then click on Create a new channel.
- This will take you to a new window that will give you an option to create a brand account.
Note: To create a new brand account or move your existing channel to a brand account, make sure that you are using the latest version of YouTube.
Once you create a new channel or move your existing channel to a brand account. Your existing videos, subscribers, views, interactions and channel layout will be transferred automatically.
However, some content may be lost in transition as it cannot be moved. This includes the channel’s Custom URL, comments made by the channel, messages(sent and received) and verification badges. If your channel contains any of this content, you will receive a notification regarding this at the time you switch.
What happens to the channel’s URL?
Once you move your personal channel to a brand account, the URL of your channel changes. For example, your personal channel’s URL is Youtube(dot)com/unboxsocial.
Crucial YouTube Metrics to Analyze
YouTube analytics has a lot to offer and therefore, to ease your data research we have divided the process into three parts namely-
- Watch time reports
- Interactions reports
- Revenue reports
A. Watch Time Reports
The watch time report is a compilation of some of the common metrics such as views, watch time and retention. It tracks traffic from your YouTube channel and the individual videos on your channel.
The overview feature for each metric contains a drop-down menu on the right side. Clicking on this drop-down menu will allow you to filter the time duration for the metric being analysed.
– Watch Time
Views are very important when deciding the success of a YouTube video. But they alone should not be considered a measure of success. Why? Because a video earns a view as soon as it reaches 30 seconds. This does not give you enough information that you can use to make changes to your videos. Especially if they are long in duration.
If you measure the success of your video only on the basis of views, you won’t understand what changes the video requires.
Watch time is the total time users have spent watching videos on your channel. This, however, represents the total minutes people have spent watching your videos and is not a per video breakdown.
-Average view duration
This metric combines watch time and views for you. Unlike watch time, this can be measured on a per video basis. It indicates the average amount of time someone spent watching your video.
A higher average view duration is indicative of good performance and will improve your channel’s rank.
-Audience Retention
Audience retention measures how engaged your audience is with your content. This metric presents data such as average view duration and average percentage viewed.
-Demographics
It is extremely important to understand your audience while creating your video strategy. The demographics metric allows you to analyze the age, gender, and geographical location of your viewers.
Why is this important? It can help you make changes to your content based on the type of your audience. It can also help you to target a different audience.
-Playback Locations
Playback Locations can help you to analyze where your content is being viewed. Whether people are finding it on their feed or searching for it. It also tells you whether they are viewing the content directly on YouTube or via different websites.
The views you receive are divided between YouTube channel page, YouTube watch page, embedded videos and mobile devices.
-Traffic Sources
Traffic Sources will tell you how are people finding your videos. This can help you to take into consideration which keywords or specific terms are working and which aren’t. This can make the SEO part of your process easier.
-Devices
This metric tells you which device are your viewers using to consume content. Are they watching videos on a desktop, mobile phone, smart TV or a gaming console?
-Live Streaming
Live streaming metrics are visible only for 48 to 72 hours after your live streaming ends. It shows peak concurrent views and all your chat messages. This allows you to track at which point was the audience most engaged during the live stream. There are no interaction or revenue reports available for live streams.
Note: Despite the limited data available under YouTube Analytics, YouTube provides other metrics that are visible only during the live stream. These metrics will be visible only when you are live on the platform.
-Translations
YouTube has a huge presence around the globe. This is why a lot of creators use YouTube tools to translate their content. If you do that, you can use the translation report to analyse the performance of localized content.
It tells you how your reach and discoverability have been impacted after making your content available to other language audiences. It also indicates whether the audience is watching the original video or the translated version of it.
B. Interactions Report
According to a report, viewers retain 95% of a message when they watch a video, as compared to only 10% when reading text. This shows how important it is to create content that is not only fun but also engaging.
The interaction reports include metrics that will tell you how engaging your content is. Metrics like subscribers, likes and dislikes, comments and sharing, all directly tell you whether users like your content or not.
-Subscribers
Tracking your subscribers’ reports can be very important in terms of checking your progress, but not so much in terms of altering content. You can see where you are getting your subscribers from and how many subscribers did you gain or lose in a given time period.
As the number of subscribers increases, your brand will grow and there is a greater chance of exposure. You can also watch this stat on a per video basis and see which video gained more subscribers.
Note: The subscribers’ data on YouTube Analytics might be different than the subscribers’ number on your channel. YouTube Analytics is delayed by 48 hours and hence doesn’t show real-time numbers.
-Likes and dislikes
Your viewers can express their feelings regarding the video with one click. Understanding your audience and what they like is the first step in creating engaging content. Tracking this metric allows you to see which video has gained more likes and based on that alters your content strategy.
Dislikes are a bad indicator for any channel but it does not actually reflect the quality of your video. For example, some videos such as opinionated ones are bound to dissatisfy some people. This does not reflect the quality of the video. To understand what your audience really thinks, you should measure comments with likes and dislikes.
-Comments
Although likes and dislikes are a quicker method to measure your audience’s reaction, comments give you a better understanding. Below the graph in this report, you can select the video you want to see the data for. The data shown includes the number of comments the video received but the comments themselves are not visible.
This is why you should monitor the comments section under your videos regularly. This is also a good opportunity to interact with your audience. Replying to an audience will boost your engagement metrics.
Tip: You should not ignore negative comments as customer service is very important. There might be only one dissatisfied customer but all of your subscribers act as spectators.
-Sharing
There is a reason why all YouTubers ask their audience to like, share and subscribe at the end of the video. This is because sharing is one of the most important metrics that measure engagement.
Why is it important to measure shares? Because someone liked your video enough to go and share it with someone. This is also important for SEO purposes. A higher number of shares indicates a higher number of backlinks. This improves the chances of your channel getting a higher rank.
Clicking on the Sharing Service filter below the graph will allow you to measure your social shares. You can see when viewers are sharing your video and via which app or social media platform they share it the most.
Note: YouTube measures only those shares that are generated via the share button available next to the video. The actual number of shares you receive could be greater than that.
-Videos in Playlist
This report indicates the number of times any of your videos have been added to someone’s playlist. This could be default playlists such as Favorites or Watch later, or a new playlist that the user might have created on his own.
The visual representation of this metric is quite similar to the Subscribers report. There are three data sets to choose from:
- Videos in playlist: Indicates the total number of times your videos are included in the user’s playlist.
- Videos added to the playlist: Indicates the total number of times videos were added to a playlist in a given time period. Even if they were removed shortly.
- Videos removed from playlists: Indicates the number of times your videos were removed from the viewer’s playlist.
- This report was formerly known as the Favorites report. Earlier it used to focus only on Favorites but now considers all the playlists a viewer might use.
-Cards
Cards were launched by YouTube in order to replace them with Annotations. They are meant to increase interactivity and boost engagement. Cards are used as CTAs and usually appear at the end of the videos, to inform users about relative videos or other merch or products. They come with clickable links.
Under the cards report, you can measure the performance of these cards. The metrics available are:
- Card teasers shown: Number of times card teasers were visible. They can have multiple impressions per view.
- Card teaser clicks: Number of clicks on a card teaser.
- Card clicks: Number of clicks on an individual card.
- Clicks per card shown: It is the CTR of each card.
C. Revenue Reports
The revenue reports are available only for YouTube partners. In order to be a partner, a channel must satisfy certain criteria.
- The channel must reach 4,000 hours in watch time.
- The channel must have 1,000 subscribers.
As soon as the channel meets these requirements, it will be reviewed by YouTube for the partnership program.
Once they become partners, they are eligible to earn money from the ads served on their videos. They also need to associate an AdSense account in order to earn money.
The two metrics available under this report are:
- Revenue
- Ad Rates
-Revenue
You can use this metric to keep a track of your earnings on YouTube. The two stats to track are:
- Estimated revenue
- Estimated ad revenue
You can only view your estimated earnings on YouTube analytics and not your finalized earnings. The finalized earnings are visible in your Adsense account report.
Below the revenue graph, you will find filters based on which you can view data based on region, time or on a per video basis. You can use this data to see your earning pattern and make changes to your strategy based on that. For Example, if you notice that you are earning more on a certain day during the week. You should try to post more during that period.
-Ad Rates
Similar to revenue, this metric is also only available for YouTube Partners. This metric provides data on YouTube Ad Revenue, estimated monetised playbacks, CPMs and ad impressions.
You can use the ad rates report to compare how different ads are performing over a period of time. Ad rates and revenue reports don’t show the same numbers. Ad rates display the amount advertisers pay to run the ads. Whereas revenue reports show the amount you will be paid.
How To Conduct YouTube Analytics
If you want to dig deeper and analyze your YouTube channel metrics, go for the YouTube Analytics by Unbox Social. This tool allows you to jump into elaborate, in-depth insights about your YouTube channel. You can also pull out detailed reports about your YouTube channel with the help of this YouTube analytics tool.
To give you a quick tour of the tool, here are the main metrics that it covers:
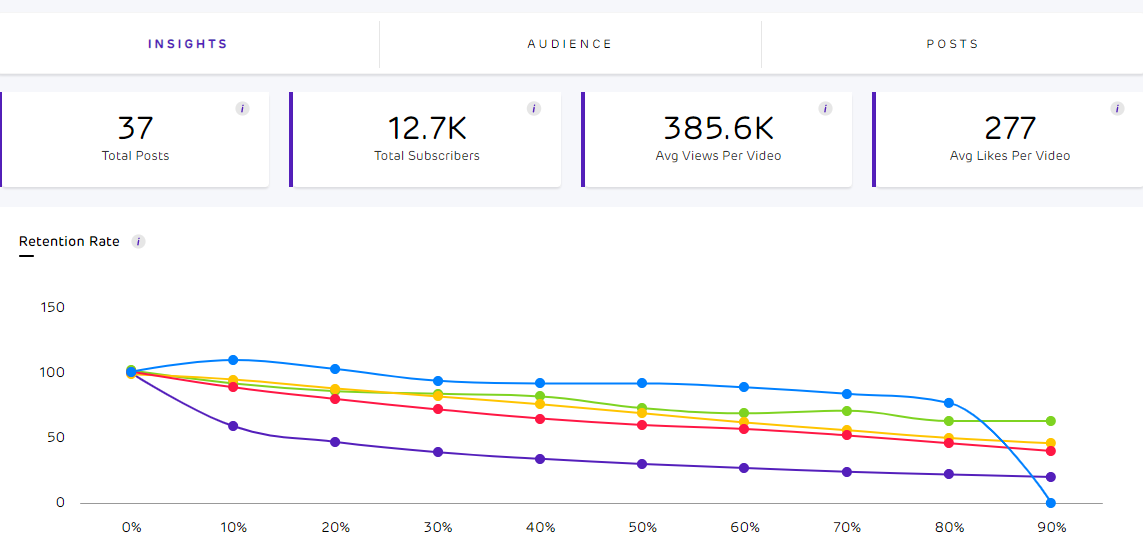
-Retention Rate
What percentage of viewers stayed till the end of the video? What percentage of viewers only saw a half of the video?
This YouTube analytics tool helps you capture how your video fared by tracking what percentage of the total viewers saw what percentage of the entire video. In doing so, you can assess the quality of your video content and accordingly alter your video content to meet up the expectations of your target audience.
-Total Video Shares and Views
Find out what number of people viewed your content, on a day-by-day basis. At the same time, get a day-wise analysis of the total number of shares on your YouTube channel. These metrics help you get a sense of how your channel is faring. In the process, you can stay on top of any fluctuations in the numbers and accordingly make changes to your YouTube strategy.
-Optimal Video Length
This YouTube analytics tool analyzes and assesses all your content and audience activity with your YouTube channel. It then provides you with the optimal length of the videos that will work for your YouTube channel. With the help of this metric, you can generate more YouTube views for your channel.
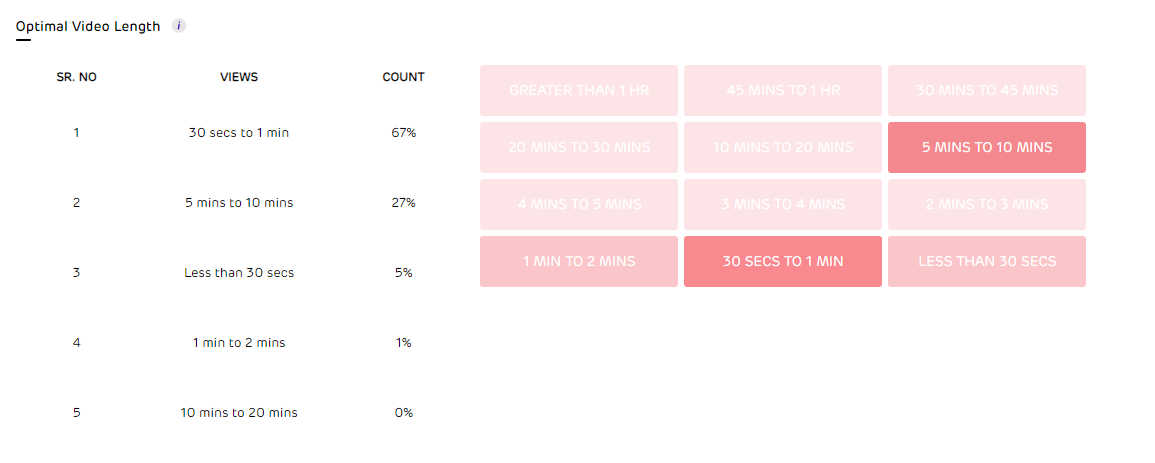
Based on an analysis and assessment of all your content and audience activity on your YouTube channel, Unbox Social provides you with an optimal video length.
-Subscribers
With this YouTube analytics tool, you can look into the number of subscribers gained and lost, as well as the net subscribers for your YouTube channel.
Keeping an eye on your subscriber growth helps you monitor any fluctuations in these numbers and put a relevant strategy in place.
-Top Videos
Based on the assessment of your video views and an in-depth analysis of all the data around your YouTube channel, this YouTube analytics tool provides you with a list of your top-performing videos. Taking cues from this data, you can boost these videos across other social media channels. Further, these insights can also feed into your content creation strategy.
Find out which of your videos are performing well and use this intelligence to create more such content on the platform.
-Audience Insights
The audience insights help you uncover important intelligence about the audiences interacting with your YouTube channel. Here, you get access to the age, gender and geographical insights of your audience.
This can help you to create country-specific videos in future for that particular audience. Or add subtitles so your message is conveyed properly in case of language barriers.

Derive vital insights about your target audience and use this intelligence to create content that your audience will enjoy watching.
Let’s assume that you are a fashion blogger who creates videos for teenagers and provides fashion tips that are suitable for them. According to the demographics, you realize that a huge section of your audience is also from the middle age section. Ranging from 30-40-year-olds. Now that you know about this, you can create content that would be useful for them also.
-Post-Wise Analytics
Look at the analytics for every video you put out on your YouTube channel. This covers the total number of likes & dislikes, video views, average view percentage and comments received on your videos.
With the help of YouTube Analytics by Unbox Social, you can uncover valuable insights about your YouTube channel and videos. With the help of elaborate data and comprehensive graphs and charts, you can map out the strategy for your YouTube channel more effectively.
Tips to Improve YouTube Strategy
Now that you know which metrics matter and how to analyze YouTube analytics. It is time to put that knowledge into use. Using the analytics you can make changes to your channel that will help you to attract more users and indefinitely, rank higher.
-Monitor your reports
You can use the Reporting feature offered by Unbox Social, to put all your data into context through comprehensive, multi-format reports. With the help of the intelligent snippets that this tool comes with, you can get a sense of how your YouTube marketing strategy is faring.
-Utilise/Include keywords
Keywords are an essential part of SEO and help you rank higher. This holds true for YouTube too. Before you publish your videos, it will be advisable to do keyword research to see which words are most suitable for your video. Based on the keywords you find, you can use them in your video title and description.
Keyword research can also help you strengthen your future strategy. You can see which words are most searched or most relevant and create videos around those keywords.
– Use the right thumbnails
Thumbnails are not just passive elements for a YouTube video. Thumbnails can impact your video performance in several ways because the viewer often decides whether to watch the video or not based on the thumbnail. Make sure your thumbnail resembles the video and generates some curiosity in the mind of the viewer.
– Focus on audience engagement
Uploading the video and forgetting about audience engagement is a very common mistake. Check the comments you receive on your videos and reply if necessary.
– Collaborate with influencers
Influencers are known for their audience reach and engagement skills. Influencers can help you reach a wider audience base on the platform. Collaborating with influencers will also help you bring newness to your video content.
Marketing on any platform or through any channel can be very difficult. But analytics can ease this process for you. It tells you how close or far you are from reaching your target. And with a platform like YouTube, which is so dynamic and competitive, it is extremely important for you to track your success.
Key Takeaways
- YouTube analytics is a process wherein you can assess the performance of your video content on the platform.
- Right from gathering YouTube channel metrics, studying Youtube subscribers to coming up with YouTube performance reports, everything forms a part of YouTube analytics.
- With YouTube channel analytics you will get data that helps you detect the pattern of how your content is being consumed by the audience.
- YouTube channel demographics will give you an account of what your subscriber base consists of.
- The watch time report is a compilation of some of the common metrics such as views, watch time and retention.
- The interaction reports include metrics that will tell you how engaging your content is.
- The revenue reports are available only for YouTube partners. In order to be a partner, a channel must satisfy certain criteria.
- The Unbox Social tool has a dedicated feature for YouTube analytics that helps you get data for your channel and also gives you insights into your competitors’ channels.